Standard Error of Measurement (SEM)
The SEM serves as a tool to estimate the potential variance between a student’s obtained score and their actual score. The implications of SEM on the interpretation of test scores are discussed in detail in Chapter 10, “Establishing Evidence of Reliability and Validity.”
The significance of SEM lies in its capacity to rectify the misconception that an observed score on a test equates to the student’s true score (Reynolds et al., 2008). In our sample data from Table 11.1, the SEM is 3.8. This implies that for an observed raw score of 72, the true score could fall within a range of 68.2 to 75.8. This range is commonly referred to as the confidence band.

Struggling to meet your deadline?
Get your assignment on Standard Error of Measurement (SEM) done by certified MDs and PhDs in the USA. ORDER NOW!
Impaired Urinary Elimination: Nursing Diagnosis and Care Plan
Imagine a scenario where the passing score for a test is set at 75. Would it be reasonable to add 4 points to all test scores if the SEM were 4? While it is not advisable to individually adjust scores or scale grades for each test, if there is a desire to scale grades, it is better practice to defer this decision until the end of the course. For instance, consider scaling up grades by three points for the first exam; however, if the scores on the second exam are notably high, would you then scale down those scores? Such actions would likely provoke student discontent.
Scaling individual test scores has the potential to disrupt the predetermined weighting of course components. A more prudent approach is to delay any grade adjustments until the conclusion of the course. At that point, carefully evaluate the means, medians, reliability coefficients, SEMs for all exams, and consider the spread of final scores before making any necessary adjustments to the final grade assignment (refer to the discussion on grading in Chapter 13, “Assigning Grades”).
The fundamental lesson to grasp from the Standard Error of Measurement (SEM) is that classroom test scores are not absolute, and they do not mirror students’ true scores. Inherent measurement errors affect all scores, necessitating a nuanced perspective when translating raw scores into test scores and subsequently into course grades. If your test development software does not supply the SEM within its statistical analysis, you can compute it using the formula featured in Exhibit 10.5.
Score Distribution
A test score distribution complements the examination of test data by providing an overview of the collective performance of the entire class on the test. A distribution offers a visual representation of test outcomes, facilitating their interpretation. Typically presented in the form of a frequency table or graphical representation, score distributions help illustrate the distribution of scores across various ranges.
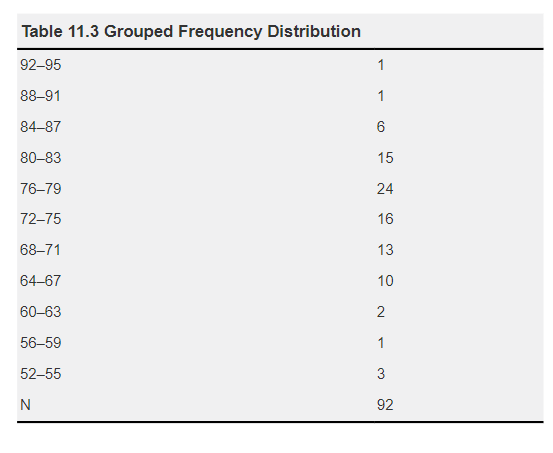
Table 11.3 presents a grouped frequency distribution corresponding to the sample data found in Table 11.1. This distribution categorizes raw test scores into four-point intervals. For instance, it reveals that six students achieved scores within the range of 84 to 87. Such a distribution offers a visual representation of the spectrum of raw scores on the test. It aids in grasping the significance of test analysis data like the mean and median while highlighting how the scores are distributed across the test.
Dont wait until the last minute.
Provide your requirements and let our native nursing writers deliver your assignments ASAP.